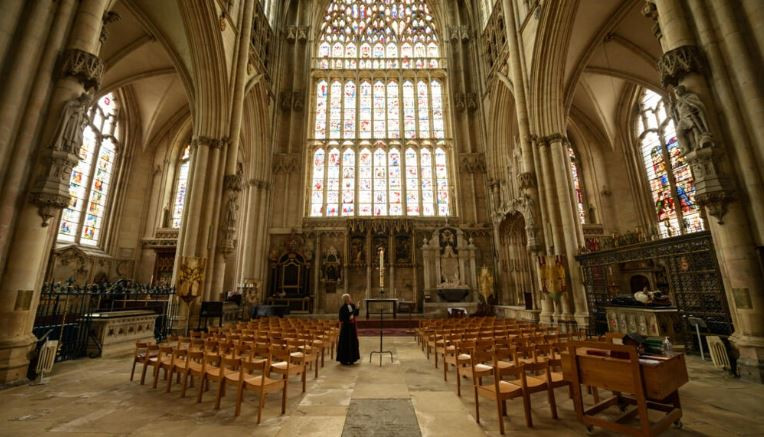
For the first time, less than half of the population in England and Wales identifies as Christian, according to census data released on Tuesday.
The 10-yearly census carried out in 2021 showed rapid growth for the Muslim population, but "no religion" was the second most common response after Christian, the Office for National Statistics (ONS) said.
In an increasingly secular age, Archbishop of York Stephen Cottrell said it was no "great surprise" that the Christian proportion was declining over time.
But he said that, facing a cost-of-living crisis and war in Europe, people still needed spiritual sustenance.
"We will be there for them, in many cases, providing food and warmth. And at Christmas millions of people will still come to our services," said the archbishop.
Also read: Black, ethnic minority people 2.5 times more likely to face poverty than whites in UK: report
"At the same time, we will be looking beyond our immediate surroundings, remembering we are part of a global faith, the largest movement on Earth and its greatest hope for a peaceful, sustainable future."
The religion question was added to the UK census in 2001. It remains voluntary to answer, but fully 94.0 per cent of respondents did, according to the ONS.
Some 27.5 million people or 46.2 per cent in England and Wales described themselves as Christian, down 13.1 percentage points from 2011.
"No religion" rose by 12 points to 37.2 per cent or 22.2 million, while Muslims stood at 3.9 million or 6.5 per cent of the population, up from 4.9 per cent before.
The next most common responses were Hindu (1.0 million) and Sikh (524,000), while Buddhists overtook Jewish people (273,000 to 271,000).
Read more: Poverty termed major reason behind human trafficking
The ONS has been releasing key sections from last year's census piecemeal, and the latest dealt with religion and ethnic identity.
Data for Scotland and Northern Ireland are released separately.
It found the number of people in England and Wales identifying their ethnic group as white had fallen by around 500,000 since 2011, from 86.0 per cent to 81.7 per cent.
The proportion identifying as white and from the British Isles stood at 74.4 per cent, down six points from 2011.
The category of "other white" grew, in a decade when Britain saw continued immigration from eastern Europe both before and after its Brexit referendum in 2016.
But the ONS noted that respondents could also choose from more options than in 2011, encouraging them to list other identities.
The second most common ethnic group after white was "Asian, Asian British or Asian Welsh" at 9.3 per cent, up from 7.5 per cent a decade ago.
Within that group, most respondents identified their family heritage as Indian, followed by Pakistani, "other Asian", Bangladeshi and Chinese.
The next largest ethnic group was the fast-growing African population, followed by Caribbean.
African evangelical churches have proliferated in London and elsewhere, providing some succour to the Christian share.

1725612926-0/Tribune-Pic-(8)1725612926-0-165x106.webp)


1732177276-0/Copy-of-Untitled-(62)1732177276-0-270x192.webp)



COMMENTS (1)
Comments are moderated and generally will be posted if they are on-topic and not abusive.
For more information, please see our Comments FAQ