Elections 2013: Over 85 million to elect new rulers
The Express Tribune illustrates the demographic breakdown of those who will make a trip to the ballot box.
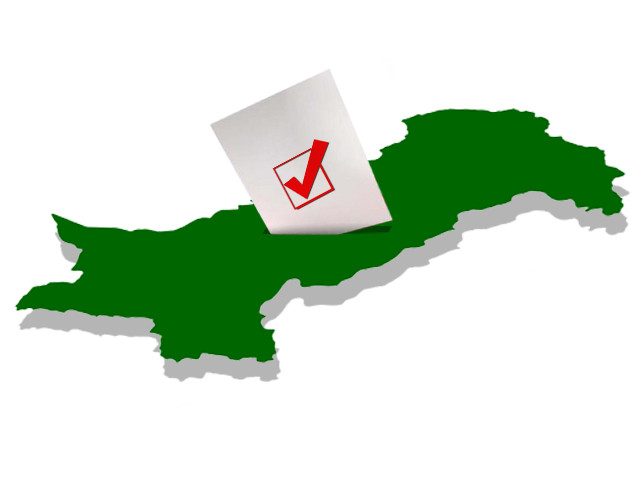
The Express Tribune illustrates the demographic breakdown of those who will make a trip to the ballot box. DESIGN: EMA ANIS
In 2008, 80,796,382 people elected their representatives. This time around, the number already stands at 85, 738,789 (as of March 6) and is expected to climb up even further. Through the figures below, The Express Tribune illustrates the demographic breakdown of those who will, in a few short weeks, make a trip to the ballot box.
Age breakdown:
18-25 years old
19.77% of total voters or 16,885,102 voters
26-30 years old
14.91% of total voters or 12,736,892 voters
31-40 years old (Largest group)
23.58% of total voters or 20,139,725 voters
41-50 years old
17.7% of total voters or 15,117,351 voters
51-60 years old
11.77% of total voters or 10,052,892 voters
61-70 years old
7.44% of total voters or 6,326,126 voters
71-80 years old
3.51% of total voters or 2,999,370 voters
81-90 years old
1.14% of total voters or 975,971 voters
91-100 years old
0.22% of total voters or 184,708 voters
>100 years old
0.005% of total voters or 3,844 voters


Published in The Express Tribune, March 23rd, 2013.


1725254039-0/Untitled-design-(24)1725254039-0-208x130.webp)











COMMENTS
Comments are moderated and generally will be posted if they are on-topic and not abusive.
For more information, please see our Comments FAQ