Public schools in Boston introduce a more accurate world map
The move was part of the district's effort to 'decolonise the curriculum'

This map, used in classrooms the world round, distorts the relative size of countries for the ease of European colonial navigation. PHOTO: AFP
The world maps portray North America as larger than Africa (it's not) and Alaska's landmass as more than Mexico (also not true).
In fact, did you know all of China, India and USA could fit into the African continent?
Where music meets mountains: A school to preserve Pamiri music
The 400-year-old map currently taught in schools is a byproduct of trying to depict the spherical Earth on a flat surface – and also perhaps of Colonialism.
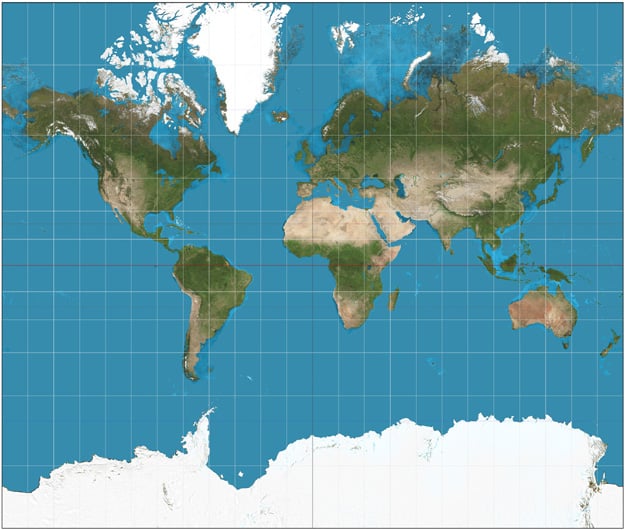 This map, created in 1569 by Gerardus Mercator for navigational purposes, warps the sizes of continents and countries. Africa is three times bigger than North America, for example, but appears smaller on the map. PHOTO: Wikimedia Commons
Schools across Boston, however, are upgrading the maps that are being taught to students. This is an effort to show the students what the world really looks like.
"We were looking at ways to explore bias in the curriculum and how we can alleviate that in the classroom, ensuring that we're giving the opportunity for students to look at the world from different perspectives and not just the same, traditional narrative," said Natasha Scott, director of history and social studies at Boston Public Schools.
The map we know dates back to 1569. Designed by cartographer Gerardus Mercator, it was used as a tool for Europeans to navigate along colonial trade routes.
"When you think about what you're viewing on the Mercator map, the Northern hemisphere — you have Europe, you have Russia, you have North America — seem incredibly large. So when you think about that, people are going to associate that, at first glance, with power," Scott said.
"So when we diminish the areas across many of our Third World countries, it's in a way disempowering them," she further added.
The map that will now be used was created in the 19th-century by Scottish map maker James Gall and later published by German cartographer Arno Peters in 1974.
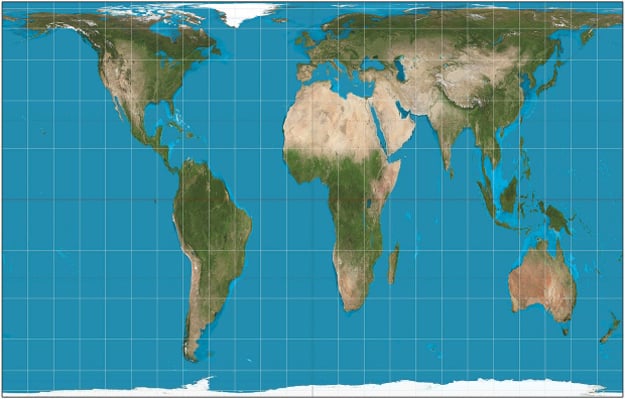 The replacement map shows countries’ true proportions to one another. Created by German historian Arno Peters and introduced to the world in 1974, the Peters Projection map has been adopted for use by the United Nations. PHOTO: Wikimedia Commons
While the Gall-Peters projection of the world distorts shapes of the continents, it accurately scales their surface areas. It is also the preferred map of the United Nations.
Justuju School seeks out good education for underprivileged children
Colin Rose, assistant superintendent in charge of the Boston Public Schools' Office of Opportunity and Achievement Gaps, said the move was part of the district's effort to 'decolonise the curriculum'.
He told the Boston Globe, "This is about maps, but it isn't about maps.
It's about a paradigm shift in our district. We've had a very fixed view that is very Eurocentric. How do we talk about other viewpoints? This is a great jump off point."
LATEST

Chinese AI models festoon Spring Festival a year after DeepSeek shock

IMF discussing electricity tariffs revisions with Pakistan
1726734110-0/BeFunky-collage-(10)1726734110-0-208x130.webp "trump administration sued for attempting to overhaul public golf course in washington")
Trump administration sued for attempting to overhaul public golf course in Washington

US military says it struck a vessel in Caribbean, killing three

Mistrial declared in case of students charged after Stanford pro-Palestinian protests

US to spend $38.3 billion to expand migrant detention capacity
MOST READ

Gold steady in global, local markets as silver gains

PMDC issues show-cause notices to 12 institutions charging fees beyond Rs1.8m cap

Is another judicial murder in the making?

Pakistan successfully launches its second indigenous Earth Observation Satellite

Bangladesh's BNP wins historic parliamentary election


COMMENTS
Comments are moderated and generally will be posted if they are on-topic and not abusive.
For more information, please see our Comments FAQ