Benefits of economic growth: Disparity between lowest and highest income groups deepens
PBS survey says expenditures of richest income group were 286% higher than the lowest income group
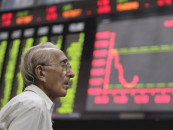
PHOTO: AFP
The Pakistan Bureau of Statistics (PBS) released the findings of the ‘Household Integrated Economic Survey (HIES) 2015-16’ that compared various socio- economic patterns with the outcomes of the 2013-14 survey.
The review showed that economic disparity between the lowest income group and the highest economic group further deepened.
An interesting trend was a reduction in the share of income from crop production in total household income. This shows that the agriculture sector has been adversely affected during the third year of the PML-N government due to domestic as well as international factors.
Salaries and wages contributed 40% towards household income, followed by businesses & services. Third largest contributor was the agriculture sector.
Survey stats
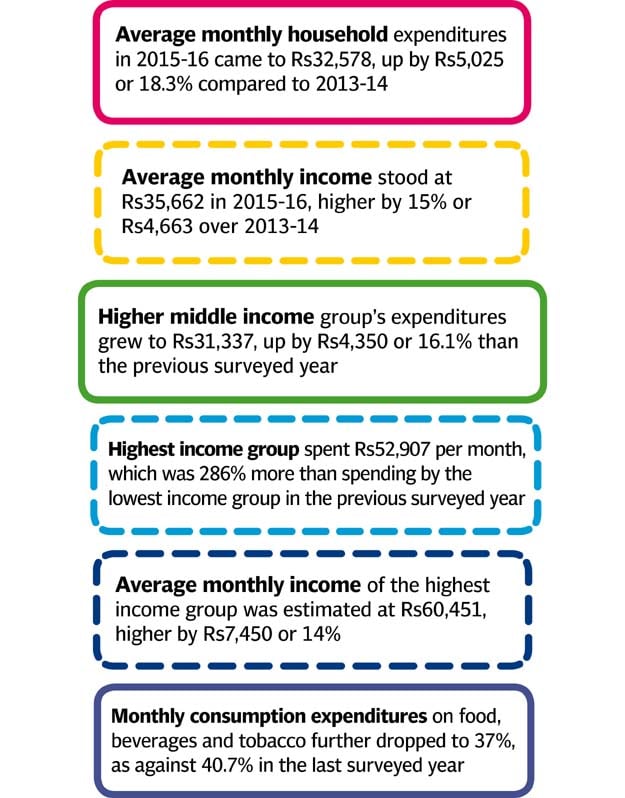
According to the survey, average monthly household expenditures in 2015-16 came to Rs32,578, up by Rs5,025 or 18.3% compared to 2013-14. This figure is used to assess the overall welfare of people. The pace of increase in all income groups was lower than the previous survey year, showing positive impacts of low global inflationary environment.
However, expenditures by the richest income group were 286% higher than the lowest income group, indicating disparity in living standards due to level of incomes.
Average monthly income stood at Rs35,662 in 2015-16, higher by 15% or Rs4,663 over the period of 2013-14. The growth in income was 3.3% less than the growth in expenditure, which suggested that people met their expenses from other sources, including consuming their savings.
The income of the richest was 306% more than the income of the poorest.
Expenditure disparity
The increase in expenditures seems to be across the board, as expenditures for all income quintiles increased in the range of 12.6% to 24% - but this pace of increase was less than in the previous years.
There was usual disparity between the lowest quintile and the highest one - the highest income group spent Rs52,907 per month, which was 286% more than spending by the lowest income group that amounted to Rs18,496 in the previous survey year.
The poorest income group’s spending increased only Rs2,354 per month in last two years. The second lowest quintile’s average monthly expenditures amounted to Rs22,874 - higher by Rs2,899 or 14.5% over the last surveyed year. The third quintile, comprising middle income group, had average monthly expenses of Rs26,705 higher by Rs2,987 or only 12.6%.
The higher middle income group’s expenditures grew to Rs31,337 up by Rs4,350 or 16.1% more than the previous surveyed year.
The higher spending was not supported by higher income except in case of the first two lowest income quintiles.
Monthly income disparity
The monthly income of all quintiles increased in the range of 14% to 19% but the major surge was in the income of the upper two quintiles who appeared beneficiaries of the government’s economic policies.
The lowest quintile’s average monthly income stood at Rs19,742 - higher by Rs3,159 or 19% and sufficient to finance the expenses. The second lowest quintile’s income stood at Rs23,826, which was 16.5% or Rs3,390 more than the previous year’s income and also matched the pace of increase in expenses.
However, the increase in income in case of both these groups was significantly lower when compared with the past.
The middle income group saw 16% increase in its income to Rs28,020. The higher middle income group’s average monthly income increased to Rs33,668, showing 15% growth but not enough to finance the expenses. The average monthly income of the highest income group was estimated at Rs60,451 - higher by Rs7,450 or 14%, still short of matching the growth in expenses.
Due to increase in expenditures, the average per capita monthly expenditures of households increased about one-fifth to Rs5,166 in the last fiscal year. However, per capita household expenses of the highest quintile were 476% more than the expenditures of the lowest quintile.
The poorest income group’s expenses increased just Rs323 per month as compared to Rs2,169 of the richest.
Monthly consumption disparity
In what appears to be another interesting trend, average monthly consumption expenditures on food, beverages and tobacco further dropped to 37%, as against 40.7% in the last surveyed year. The expenses on clothing, transport and education slightly increased.
With a slight increase over the previous year, overall income earners nonetheless remained below two persons per family. According to the survey, the average national household size remained at 6.15 persons per family, slightly lower than the previous level of 6.35.
The average household size of the poorest family is 8.6 persons compared to 6.3 members of the richest household.
Published in The Express Tribune, February 26th, 2017.
Like Business on Facebook, follow @TribuneBiz on Twitter to stay informed and join in the conversation.










COMMENTS
Comments are moderated and generally will be posted if they are on-topic and not abusive.
For more information, please see our Comments FAQ