Rebased Consumer Price Index
“Poverty, what poverty? People have to wait to be seated at restaurants?”

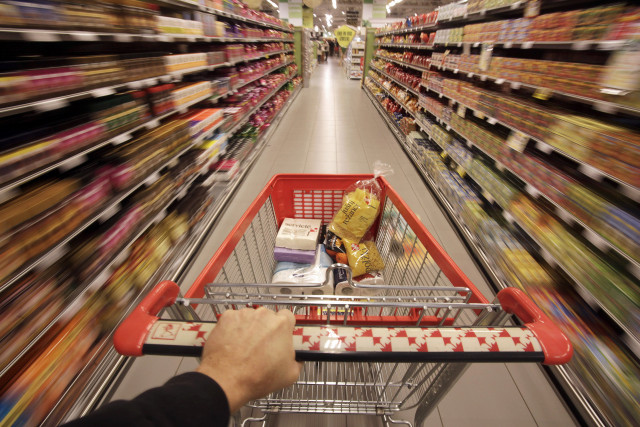
A shopping cart is pushed down the aisle in this REUTERS photo illustration.
The new base has not been announced all of a sudden. It requires new surveys to reflect various changes in consumption patterns. This exercise was carried out in 2015-16. A technical committee overseeing the work had finalised its report last year. At long last in April this year, the Governing Council of the PBS approved the change of base from 2007-08 to 2015-16. This council is the highest forum for approving major changes in the statistical system under the General Statistics (Reorganization) Act, 2011. After the approval by the Governing Council, the Ministry of Planning, Development, and Reform, the new minder of the PBS, took the matter to the Economic Coordination Committee (ECC) of the Cabinet, only to be reminded that the Governing Council is fully competent to make decisions regarding a change of base. Autonomy, they say, is not just a matter of legislation; it has to be exercised as well.
Changing the base at regular intervals is routine, based as it is on good economic reasons. The more interesting part is, however, the changes it entails in the relative significance — the so-called weights — of the items covered. There is no change in perishable food items and an insignificant change in the non-perishable food items. At around one-third, they use up the largest proportion of the family budget. This is typical of a developing economy. In the process of development, however, the size of the weight declines. This is not the case here. Secondly, the largest decline of as much as six percentage points is in the second-largest category of housing, utilities, and fuels, which is contrary to perceptions. Transport, furnishing and household equipment maintenance had to come down relatedly. Thirdly, the gain of as high as 7.8 percentage points by restaurants, hotels and miscellany makes it the third-largest category. Has the PBS succumbed to the common middle-class retort: “Poverty, what poverty? People have to wait to be seated at restaurants?” They are also spending more on clothing and footwear as well. Finally, the social sector presents a mixed picture. Health costs have risen, while those of education, recreation, and culture have declined. As in the past, the publication of the full report of the technical committee is necessary to duly interpret the results.
Since the start of the official poverty estimation in 2001-02, the poverty line was adjusted to compare like with like, by using the CPI. It wasn’t quite that because the CPI was measured only for urban consumers. A start has been made to correct this exclusion by adding a rural component covering 27 centres and 244 items to the national CPI.
Published in The Express Tribune, September 13th, 2019.
Like Opinion & Editorial on Facebook, follow @ETOpEd on Twitter to receive all updates on all our daily pieces.


COMMENTS
Comments are moderated and generally will be posted if they are on-topic and not abusive.
For more information, please see our Comments FAQ