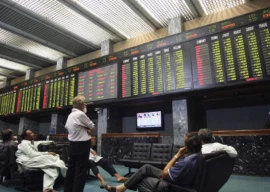
This does not work out sometimes, like in the fiscal year 2010 when everyone was issuing reports about the KSE-100’s 34 per cent gain, which even though technically true ignores the fact that actual gains of the index were minimal.
The gain was mainly due to heavy weighted scrips such as the OGDC which are cornered by one foreign fund, according to Standard Capital Securities’ research head, Faisal Shaji.
He explains that the market’s gains in fiscal year 2010 would not be truly meaningful if stocks like OGDC were to be set aside. “The index would be hovering somewhere around 7,600 points, if a few blue-chip stocks were set aside for arguments sake,” said Shaji.
Investors use indices to track the performance of the stock market. The index shows how the economy is doing by reflecting the state of its constituent stocks. It would be too difficult to track every single security trading in the country, but a smaller sample of the market that is representative of the whole can be put in place.
But as the case is, the KSE-100’s movement is biased towards a few blue-chip stocks because of their large amount of paid-up capital.
The KSE-30 free-float based construction is much more representative. KSE’s head of marketing and business development Anita Mirza declined to comment.
The benchmark KSE-100 did gain 33.7 per cent during the fiscal year 2010. But what most market analysts failed to identify was that the actual gains were from the blue-chip laden KSE-30 which increased by 24 per cent. Furthermore, the top 10 scrips that gained in relation to the KSE-100 were either third-tier or illiquid stocks, all except for FFBL and OGDC; which increased uncharacteristically by 80 per cent.
According to all consensus estimates of the market, OGDC yielded a price to earnings ratio of 10x to 10.5x in the fiscal year 2010 and could not be described as a top pick or driver of equities for normal investors as it is too expensive to be feasible. Exploration and production companies normally have yields this high; why not invest in an E&P company whose price to earnings ratio is even higher.
OGDC’s three-year median price earnings ratio including that of the fiscal year 2010 is 9.1x. Compare this with its small but attractive peer Pakistan Oilfield’s whose three-year median price to earnings ratio is 6.7x.
Published in The Express Tribune, July 9th, 2010.


1732486769-0/image-(8)1732486769-0-270x192.webp)


COMMENTS
Comments are moderated and generally will be posted if they are on-topic and not abusive.
For more information, please see our Comments FAQ